

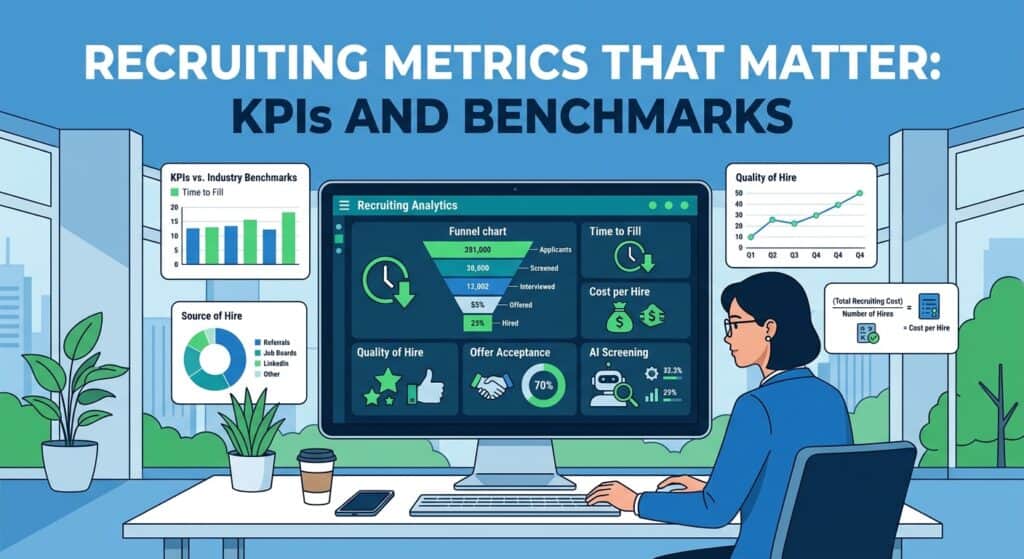
Quick answer: The recruiting metrics that matter in 2026 are time to fill, time to hire, cost per hire, quality of hire, offer acceptance rate, source of hire, stage pass through rates and hiring manager satisfaction. Track them against real benchmarks: SHRM puts nonexecutive cost per hire at $5,475 and median time to fill at 39 days, and Gem puts offer acceptance at 82%. Add a small set of AI era metrics so you can see whether your AI tools are actually saving time without quietly rejecting good people.
What changed in 2026: Application volume tripled, AI now screens and drafts outreach for most teams, and leaders want proof of quality rather than speed alone. That means new metrics like AI screening pass rate, human override rate and recruiter hours saved belong on the dashboard.
Who this is for: In house recruiters, agency desk recruiters, sourcers and TA leaders who want a short list of numbers worth tracking and a dashboard they can build in Google Sheets or their ATS this week.
What are good recruiting metrics to track in 2026?
Good recruiting metrics answer one of three questions: are we fast, are we efficient, and are we hiring people who work out. After 20 years on a technical recruiting desk, my advice is simple: pick roughly ten metrics, define each one the same way every month, and compare them to a published benchmark.
The core list has not changed much, but the context has. Ashby’s 2026 data shows the average recruiter now processes 291 applications per hire, compared to roughly 100 in early 2021. When the top of the funnel is that noisy, volume metrics stop meaning much and conversion and quality metrics carry the weight.
Which recruiting metrics examples should every team start with?
Start with the metrics below. Each has a formula you can calculate from ATS exports and a checked benchmark. Where no reliable public benchmark exists, track your own trend line.
| Metric | Formula | Benchmark | Source |
|---|---|---|---|
| Time to fill | Days from requisition opened to offer accepted | 39 day median for nonexecutive roles (2026) | SHRM 2026 |
| Time to first fill | Days from job opened to first hire made | About 8 weeks for business roles, 10 weeks for technical (2026) | Ashby 2026 |
| Time to hire | Days from candidate entering the pipeline to offer accepted | 41 days on average, up from 33 in 2021 (2025 report) | Gem 2025 |
| Cost per hire | (Internal recruiting costs + external costs) ÷ total hires | $5,475 nonexecutive, $35,879 executive (2025) | SHRM 2025 |
| Offer acceptance rate | Offers accepted ÷ offers extended × 100 | 82%, highest since 2021 (2026 report) | Gem 2026 |
| Quality of hire | Average hiring manager rating at 30, 60 and 90 days (1 to 5 scale) | 73% of hires exceed expectations on first score (2026) | Ashby 2026 |
| Applicant to hire rate | Hires ÷ total applicants × 100 | 0.5% of applicants are hired (2026 report) | Gem 2026 |
| Interviews per hire | Total interviews held ÷ hires | 11.7 for business roles, 17.6 for technical (2026) | Ashby 2026 |
| Source of hire | Hires from a channel ÷ total hires | Job boards drive 49% of applications but 24.6% of hires (2025 report) | Gem 2025 |
| Hiring manager satisfaction | Average score on a short survey after each hire | No public benchmark; 44% of TA pros use it inside quality of hire (2025) | LinkedIn 2025 |
| Candidate NPS | % promoters minus % detractors on a 0 to 10 survey | No reliable public benchmark; track your own trend | Internal survey |
How do you calculate time to fill vs time to hire?
Time to fill measures the requisition. Time to hire measures the candidate. Time to fill starts the day the job opens and ends when an offer is accepted, so it tells the business how long a seat sits empty. Time to hire starts when a specific person enters your pipeline and ends at acceptance, so it tells you how fast your process moves once you find someone good.
Keep the two separate and segment them by role type. Ashby found senior roles take 37% longer to fill than junior roles, and technical roles take about 15 more days than business roles. One company wide time to fill target will make your engineering recruiters look slow when they are performing normally.
Where does time to hire actually get lost?
Usually in small delays rather than one big bottleneck. The same Ashby report names four: application review, scheduling, feedback and decision making, and offer approvals. Teams using automated scheduling confirmed interviews in a median of 3.7 hours versus 5 hours for manual scheduling. Measure each stage in days so you can see which one is dragging.
What is a good cost per hire and quality of hire benchmark?
For cost per hire, the most cited US benchmark is SHRM’s 2025 figure of $5,475 for nonexecutive roles and $35,879 for executive roles. SHRM notes executive hires cost nearly seven times more. Count recruiter salaries and tools as internal cost, and agency fees, job ads and background checks as external cost. You can run your own numbers with the cost per hire calculator in our free recruiter tools.
Quality of hire is the metric everyone wants and few measure. SHRM reports only 20% of organizations track it. LinkedIn’s 2025 survey found 89% of TA pros say measuring it will become more important, yet only 25% feel highly confident they can measure it well. Gartner’s 2025 guide makes the same point: few recruiting leaders are confident measuring this metric.
What is the simplest way to measure quality of hire?
Send the hiring manager a one question survey at 30, 60 and 90 days: “How is this hire performing, from 1 to 5?” Ashby’s analysis of over 35,000 scorecards found the first score predicts later scores well, and referred hires averaged 4.0 versus 3.8 for inbound and 3.9 for sourced. Add first year retention and you have a quality metric you can defend in a leadership meeting.
Which recruiting metrics matter for agency recruiters vs in house?
Agency desks are paid on placements, so their metrics follow revenue. In house teams are measured on business outcomes, so their metrics follow hiring quality and speed. Agency recruiters also compete with other firms for the same client, so speed to submit decides many deals.
| Agency desk metric | Formula | In house equivalent |
|---|---|---|
| Submittals per week | Candidates sent to clients in the week | Candidates advanced to hiring manager review |
| Submittal to interview ratio | Client interviews ÷ submittals | Recruiter screen to manager interview rate |
| Interview to placement ratio | Placements ÷ client interviews | Onsite to offer rate |
| Fill ratio | Jobs filled ÷ jobs worked × 100 | Requisitions filled on time |
| Time to place | Days from job order to placement | Time to fill |
| Revenue per recruiter | Gross fees or margin ÷ billing recruiters | Hires per recruiter per quarter |
Speed is where top agencies separate themselves. Bullhorn’s GRID 2026 survey of nearly 2,300 recruitment professionals found 56% of top performing firms report an average time to place under 10 days, and firms with AI embedded throughout the workflow have more than double the chance of fill rates above 75%. If you run a desk, see our agency tech stack guide for the tools behind those numbers.
For in house capacity, compare workload rather than activity. Gem’s 2025 report found the average recruiter manages 14 open requisitions, and Ashby reports 7.3 hires per recruiter per quarter by Q1 2026.
What new AI recruiting metrics should you track in 2026?
If AI is sourcing, screening or writing outreach for you, you need numbers that prove it is helping. The biggest risk is invisible: an AI screen that quietly rejects qualified people. Greenhouse’s 2025 survey found only 21% of US recruiters are very confident their systems are not rejecting qualified candidates. These five metrics close that gap.
- Share of shortlist sourced by AI. Candidates on the shortlist found by an AI sourcing or rediscovery tool ÷ total shortlist. Pair it with quality of hire by source so you know whether AI finds people who work out. Gem’s 2026 report found 46% of sourced hires now come from rediscovered candidates already in the CRM or ATS.
- AI screening pass rate. Applicants the AI advances ÷ applicants it reviews. A sudden drop usually means the criteria drifted, not that the market changed.
- Human override rate. AI decisions a recruiter reverses ÷ AI decisions reviewed. Sample 20 AI rejections a week and count how many you would have advanced. A high override rate means the screen needs new instructions.
- Reply rate on AI drafted outreach. Replies ÷ messages sent, split by AI drafted and human written. In hireEZ’s 2025 data on 2.7 million recruiting emails, AI supported emails reached a 17.6% reply rate versus 13% without AI, against a 15.2% overall average.
- Recruiter hours saved and time to first submit. Log hours on sourcing and screening before and after rollout, and days from intake to first qualified candidate in front of the manager. LinkedIn found teams using generative AI save about 20% of their work week, and Bullhorn reports 46% of firms say AI cut screening time in half or better.
If you are still choosing tools, our roundups of AI recruiting tools and AI resume screeners cover what each one can report on.
What are the key diversity recruiting metrics?
The most useful diversity metric is pass through rate by group at every stage, because averages hide where the gap opens. Gem’s 2025 data showed women face lower pass through rates at the top of the funnel but higher success in later stages. You would miss that entirely if you only tracked hires.
Track three numbers: candidate slate composition at the shortlist stage, stage pass through rate by group, and selection rate ratio. Under the EEOC four fifths rule, a selection rate for any group below 80% of the highest group’s rate is generally regarded as evidence of adverse impact. Run this check on AI screening stages too, since those decisions count as part of your selection process.
Which recruiting metrics should you stop obsessing over?
Some numbers feel productive but rarely change a decision. Drop them from the main dashboard or move them to a back tab.
- Total applications. With 291 applications per hire, volume measures noise. Track qualified applicants instead.
- Email open rates. Opens measure curiosity, not interest. Reply rate and positive reply rate are what matter.
- One company wide time to fill. It punishes hard roles. Segment by role family and level.
- Cost per hire on its own. A cheap bad hire is expensive. Always read it next to quality of hire.
- Messages sent or calls made. Activity counts reward busy work. Submittals that turn into interviews reward judgment.
Our guide to recruiting automation mistakes covers how chasing activity numbers leads teams to automate the wrong things.
What should a recruiting metrics dashboard show weekly, monthly and quarterly?
A recruiting KPI dashboard works when each metric is reviewed at the pace it can actually move. Weekly numbers drive action on open roles. Monthly numbers show process health. Quarterly numbers prove value to leadership. Build it as three tabs in Google Sheets fed by an ATS export, or as three saved reports in your applicant tracking system.
| Cadence | Metrics to show | Who reviews it | Decision it drives |
|---|---|---|---|
| Weekly | Open reqs per recruiter, submittals, submittal to interview ratio, interviews scheduled, offers out, time to first submit, AI override sample | Recruiters and team lead | Which roles need sourcing help or a hiring manager nudge this week |
| Monthly | Time to fill and time to hire by role family, stage pass through rates, offer acceptance rate, source of hire, reply rate on AI vs human outreach, AI screening pass rate | TA lead or agency owner | Where the process is slow, which channels to fund, whether AI settings need changes |
| Quarterly | Cost per hire, quality of hire (30, 60, 90 day scores), first year retention, hiring manager satisfaction, candidate NPS, diversity pass through and selection rate ratios, recruiter hours saved, revenue per recruiter for agencies | Leadership and clients | Budget, headcount, tool renewals and process changes |
How do you build a recruiting dashboard in Google Sheets?
Export candidates with stage, stage date, source and requisition ID from your ATS each week into a raw data tab. Use COUNTIFS to count candidates per stage and source, and simple date subtraction for time to fill and time to hire. Add a benchmark column beside each metric so the sheet shows good or bad at a glance.
Quick answers
What are the most important recruiting metrics?
Time to fill, time to hire, cost per hire, quality of hire, offer acceptance rate and source of hire. Together they cover speed, efficiency and outcome. Add hiring manager satisfaction if you can survey managers consistently.
What is a good offer acceptance rate in 2026?
Gem’s 2026 benchmarks put the average at 82%, the highest since 2021. If you are well below that, look at compensation alignment and how long candidates wait between final interview and offer.
What is the average cost per hire?
SHRM’s 2025 benchmarking puts it at $5,475 for nonexecutive roles and $35,879 for executive roles. Your number will vary with industry, role mix and agency spend.
How long should it take to fill a role?
SHRM’s 2026 data shows a median time to fill of 39 days for nonexecutive positions. Ashby’s data shows technical roles take about 10 weeks to first fill versus 8 weeks for business roles.
How do I measure whether AI screening is working?
Track the AI screening pass rate and the human override rate. Review a weekly sample of AI rejections, and check selection rates by group against the four fifths rule.
What is the difference between recruiting metrics and recruiting KPIs?
A metric is any number you measure. A KPI is a metric with a target attached that the team is accountable for. Most teams should run six to eight KPIs and keep the rest as supporting metrics.
The bottom line
Track fewer metrics and define them tightly. Keep the classic core of time to fill, time to hire, cost per hire, quality of hire and offer acceptance, compare each to a real benchmark, and add AI era metrics like human override rate and reply rate on AI drafted outreach so automation stays honest. If your team is new to AI, start with the free lessons in our AI Recruiting Academy.
Sources: SHRM 2025 Benchmarking, SHRM 2026 Recruiting Benchmarking, Gem 2026 Benchmarks, Gem 2025 Benchmarks, Ashby Recruiter Productivity, Ashby Recruiting Operations, Ashby Quality of Hire, LinkedIn Future of Recruiting, Gartner Quality of Hire, Bullhorn GRID 2026, Bullhorn GRID press release, Greenhouse AI in Hiring, hireEZ Outreach Benchmarks, EEOC 29 CFR 1607.4
Free newsletter
Get the Work Insiders weekly
One email a week: the recruiting and HR tech news that mattered, the tools we just added to the directory, and one practical guide. No spam, and you can unsubscribe in one click.